New Features
28 August 2024
Overview: Dashboard Global Filters allow users to apply filters across multiple charts within a dashboard, providing a unified view of filtered data.
Updates:
1. Global Filter Application:
Apply a single filter to multiple charts, ensuring consistent data views across the dashboard.
2. Enhanced Filtering Options:
Simplifies the filtering process by applying changes globally rather than individually.
Benefits:
Consistent Filtering: Ensures that all charts on the dashboard are filtered consistently, simplifying data analysis.
How it works?
- Click on Dashboards App from Administration section
Warning: Chart Designer or Administration access rights is required to view the Dashboard App.
- Click New button to create a dashboard or select an existing one to edit. (In this scenario you can edit an existing one)
We can create a scenario to understand the process easily. Let’s think you are a Sales
Team Manager and you and you want to filter CRM Team dashboard in a two ways :
Salesperson and Lead’s State. With your Salesperson filter, you want to ensure that each sales representative reaches their goals by tracking their own performance and current opportunities, and with your Lead's State filter, you want to enable the representative to analyse the stages of all leads and take action.
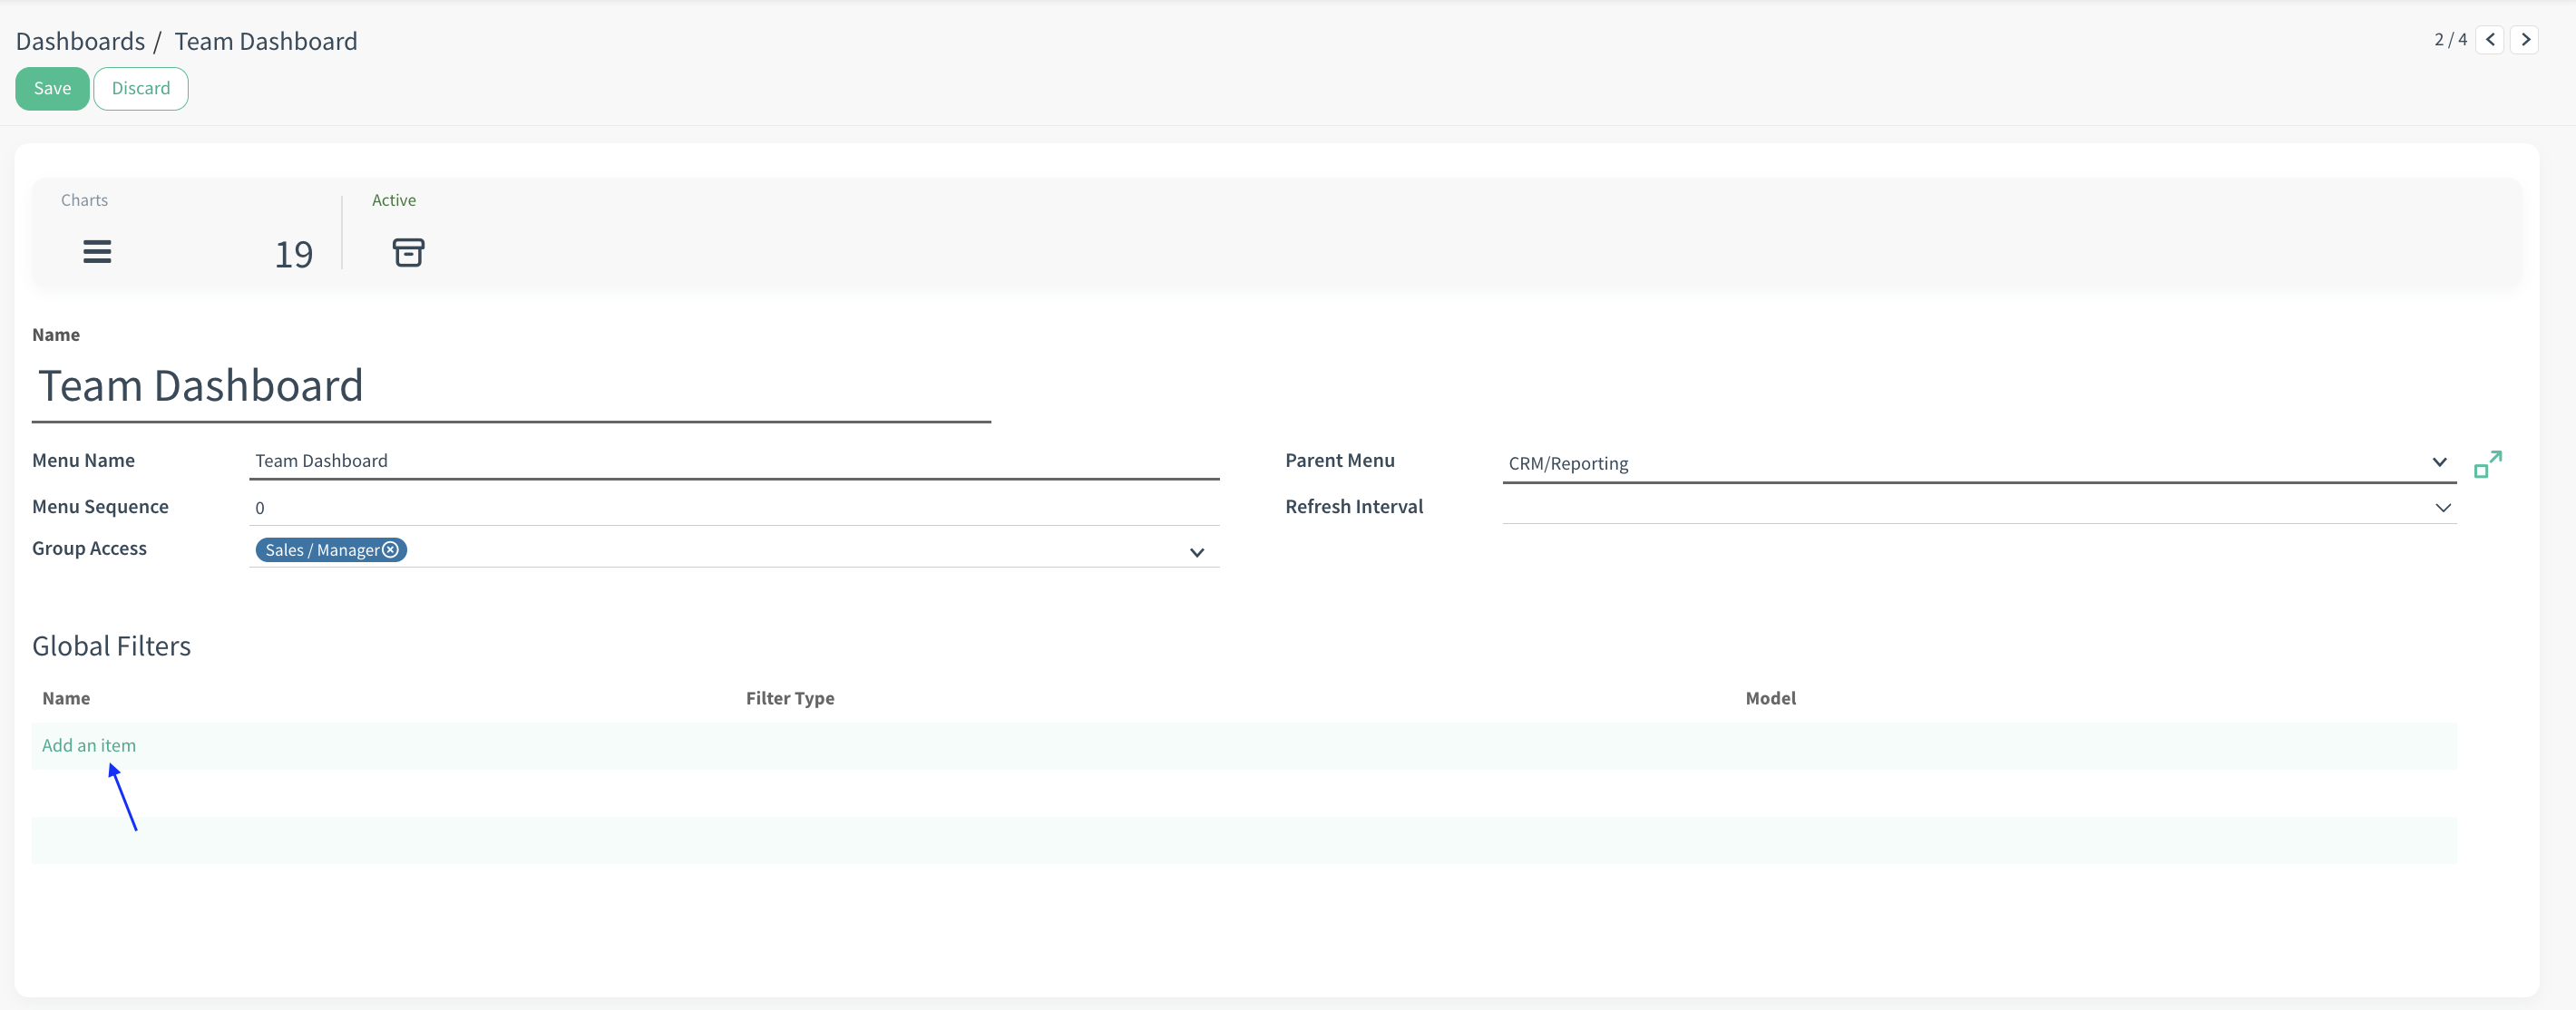
- You can add global filters from Global filters list by clicking Add an item button.


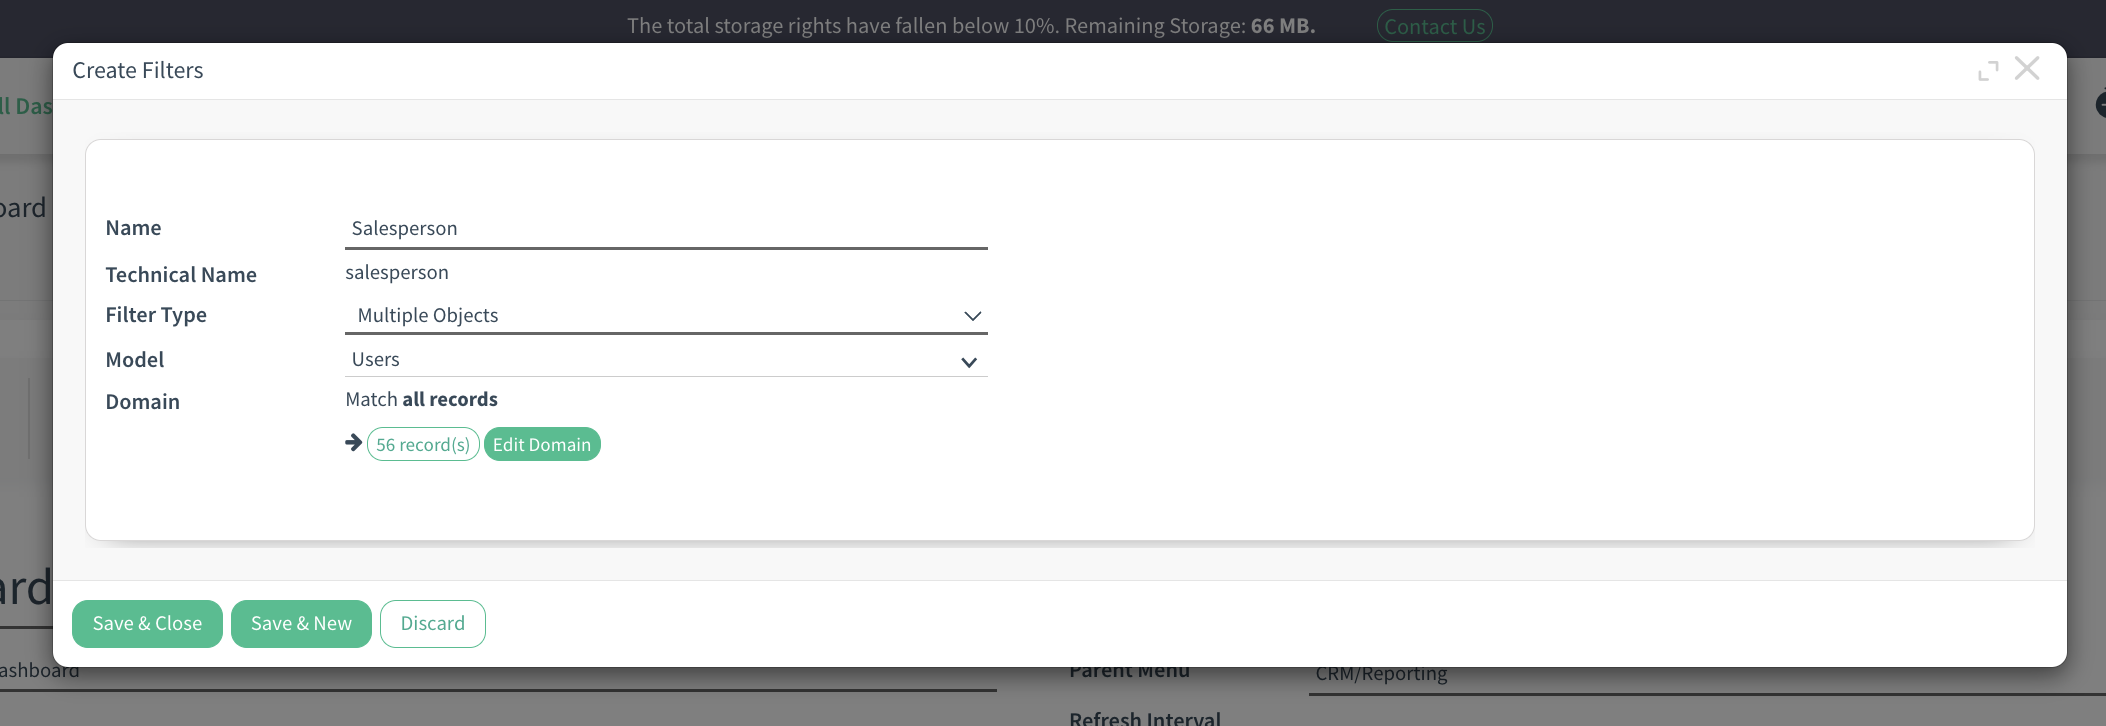
- After giving a name for the Global filter from the pop-up, you need to select the filter type. There are 6 types of filter:
- Single Object:Allows the user to filter the dashboard based on the selection of a single record from a specific model (e.g., filtering by one customer or one product).
- Single Object:Allows the user to filter the dashboard based on the selection of a single record from a specific model (e.g., filtering by one customer or one product).
- Multiple Object: Allows the user to filter the dashboard based on the selection of multiple records from a specific model (e.g., filtering by multiple customers or products).
- Date: Allows the user to filter the dashboard based on a specific date or range of dates (e.g., filtering data within a certain date range).
- Datetime: Allows the user to filter the dashboard based on a specific datetime or range of datetimes (e.g., filtering by a precise timestamp).
- Boolean: Allows the user to filter the dashboard based on a true/false (yes/no) value (e.g., filtering data based on whether a condition is met or not).
- Char: Allows the user to filter the dashboard based on a character or string field (e.g., filtering data by name, description, or code).
- Select the related model the field you want to filter. For example, Salesperson filter use Salesperson field for filtering. Salesperson field’s model is Users. So you should select Users model for the Salesperson filter.
- If you want to limit the filter with a condition you can use Domain field.


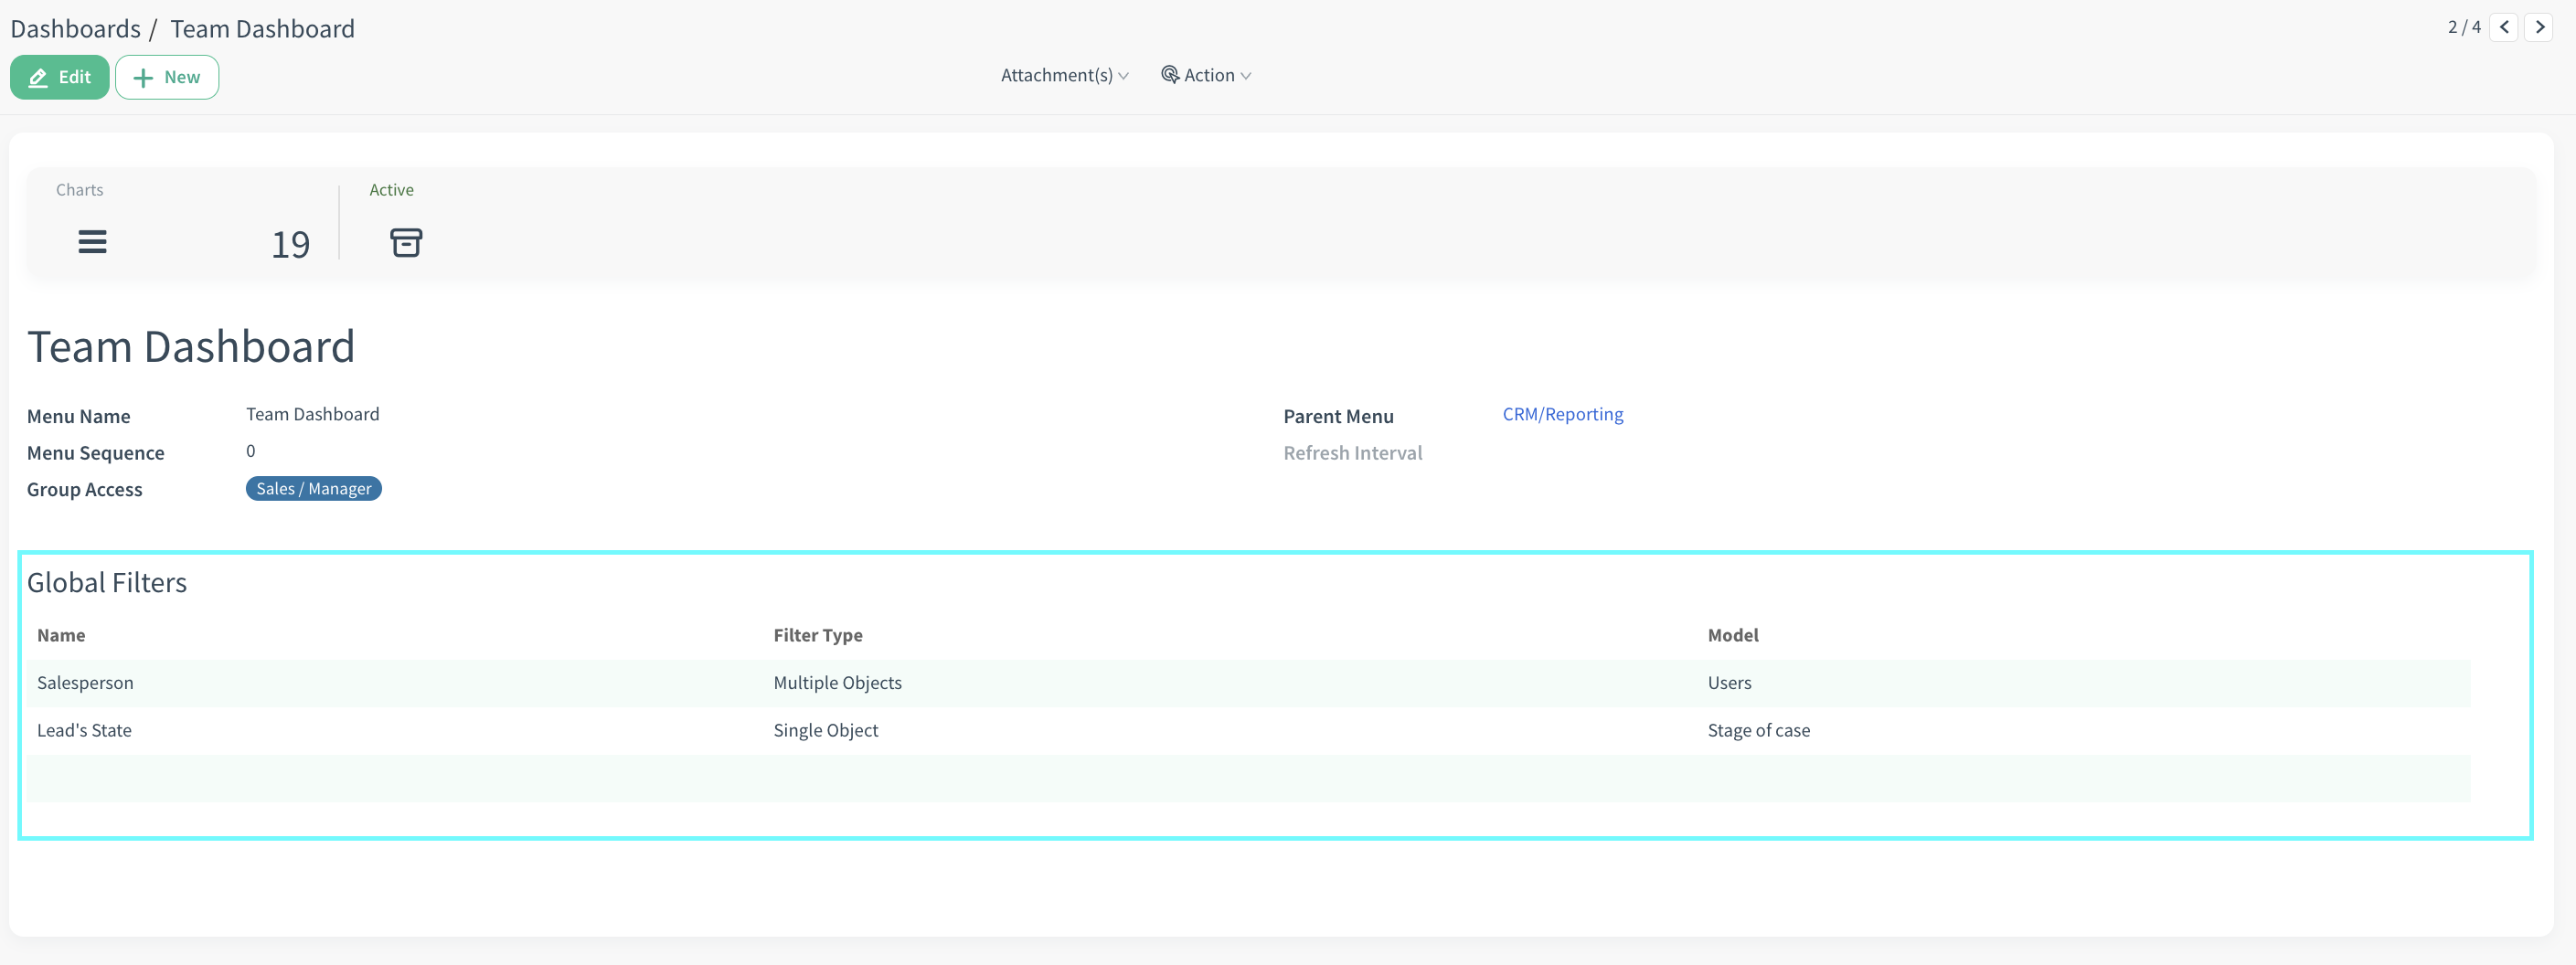
- After setting Lead’s state filter you will see the page like this.

- Now, you must map this global filters with the chart you want to filter. To do this click charts stat button, then select and click the chart you want to map.

- Now, you must map this global filters with the chart you want to filter. To do this click charts stat button, then select and click the chart you want to map.
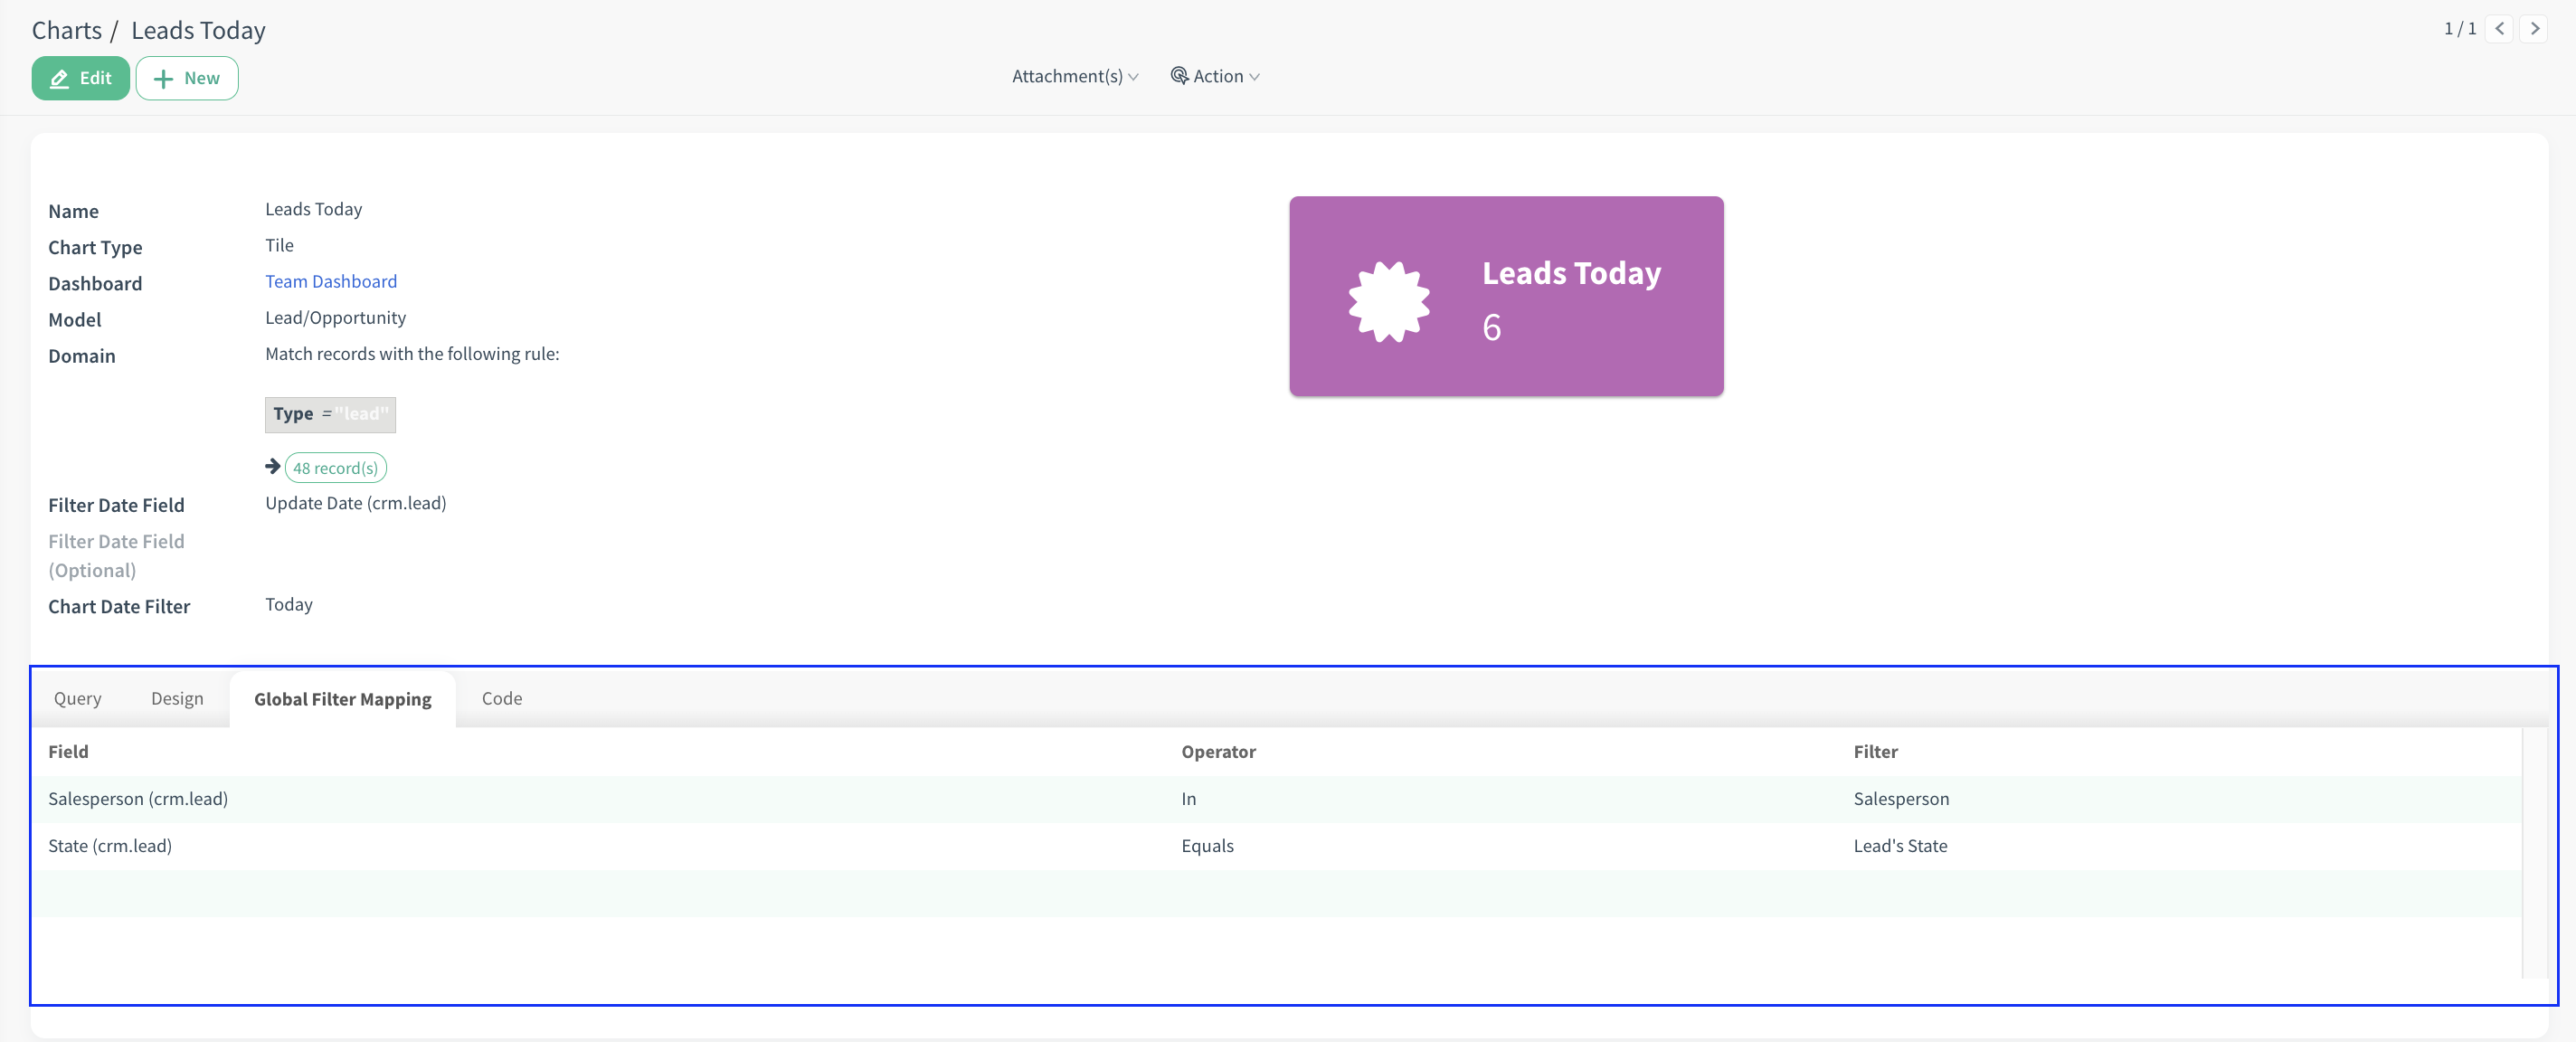
- On the Global Filter Mapping Tab, you should select fields and choose the right operatör for the filter. There are several operators:
• Equals: Matches records where the field’s value is exactly equal to the filter value. Example: State (crm.lead) Equals Qualified.
• Not Equals: Matches records where the field’s value is not equal to the filter value. Example: State (crm.lead) Not Equals Lost.
• In: Matches records where the field’s value is in a specified list of values.
Example: Salesperson (crm.lead) In [John, Jane, Emma].
• Not In: Matches records where the field’s value is not in the specified list of values. Example: Country (res.partner) Not In [USA, Canada].
• Contains: Matches records where the field’s value contains the specified value.
Example: Description (crm.lead) Contains urgent.
• Not Contains: Matches records where the field’s value does not contain the specified value. Example: Description (crm.lead) Does Not Contain cancel.
• Greater Than: Matches records where the field’s value is greater than the filter value. Example: Amount (sale.order) Greater Than 1000.
• Less Than: Matches records where the field’s value is less than the filter value.
Example: Amount (sale.order) Less Than 500.
• Greater Than or Equal To: Matches records where the field’s value is greater than or equal to the filter value.Example: Amount (sale.order) Greater Than or Equal To 500.
• Less Than or Equal To: Matches records where the field’s value is less than or equal to the filter value. Example: Amount (sale.order) Less Than or Equal To 1000.
In this example, we will filter Salesperson with “In” operator and Lead’s state with “Equals” operator.

- After mapping filters now you can go to Team Dashboard page from CRM -> Reporting Menu -> Team Dashboard. And focus on Leads Today Chart. Now, there are 6 leads without filters.

- After adding and applying Cloudoffix as Salesperson and Contacting as Lead’s State filter, there are 4 leads.

In this example, we will filter Salesperson with “In” operator and Lead’s state with “Equals” operator.

- After mapping filters now you can go to Team Dashboard page from CRM -> Reporting Menu -> Team Dashboard. And focus on Leads Today Chart. Now, there are 6 leads without filters.

- After adding and applying Cloudoffix as Salesperson and Contacting as Lead’s State filter, there are 4 leads.

CloudOffix Insights
Want more posts like this?
Explore the blog for similar articles.
Browse All Articles
