
Overview: The Info button on dashboard charts is now fully configurable. Instead of opening a fixed and unchangeable grouped list, each chart can trigger a custom server action — showing exactly the filtered and grouped records you want.
Updates:
1. Customizable Info Button Behavior: Each chart’s info button can now be linked to a personalized server action.
2. Advanced Filtering & Grouping: You can define group-by, filters, domains, and context directly from the Show Records action.
Benefits:
• Precise & Relevant Data Control: Each chart shows exactly the filtered or grouped records you configure.
• Cleaner Navigation & Easy Export: Users get a clearer dataset behind every chart and can export the filtered results instantly.
How it works?
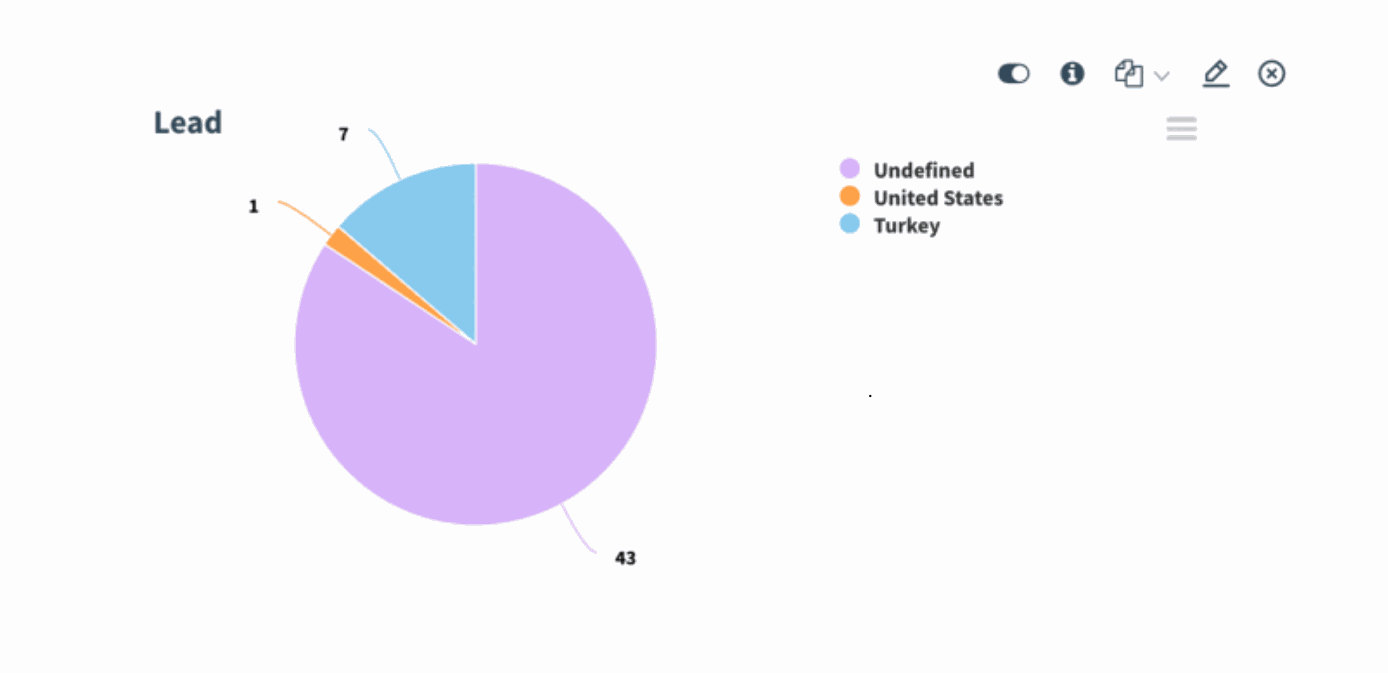
- Open your dashboard and locate the chart you want to configure. Click the Edit (pencil) icon on the chart
)%20-%202026-02-12T164722.585.png?access_token=f44ecbe9-c8bb-4f51-92bf-d2eddb92f3b0)
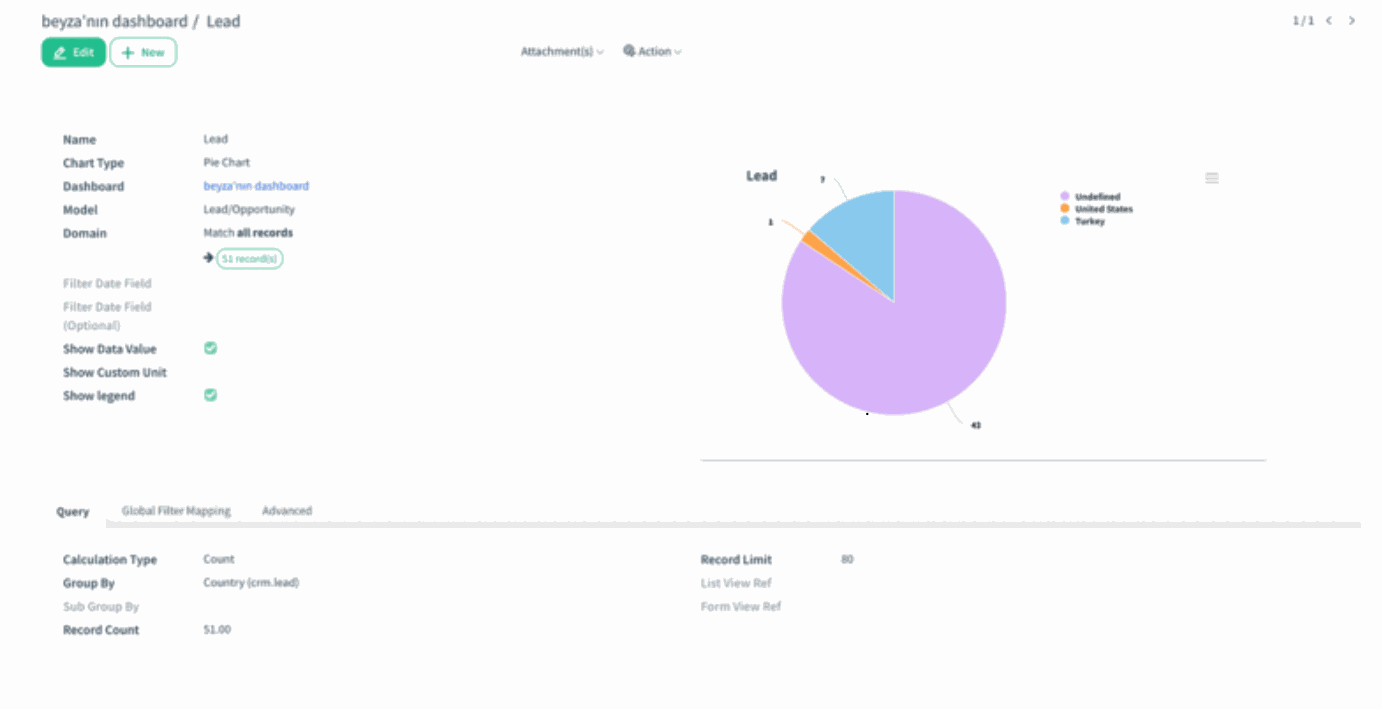
- The chart form opens. Here you can review chart name, model, domain, and query settings.
)%20-%202026-02-12T164935.620.png?access_token=e1500034-c143-40ae-9ef3-5295effa4729)
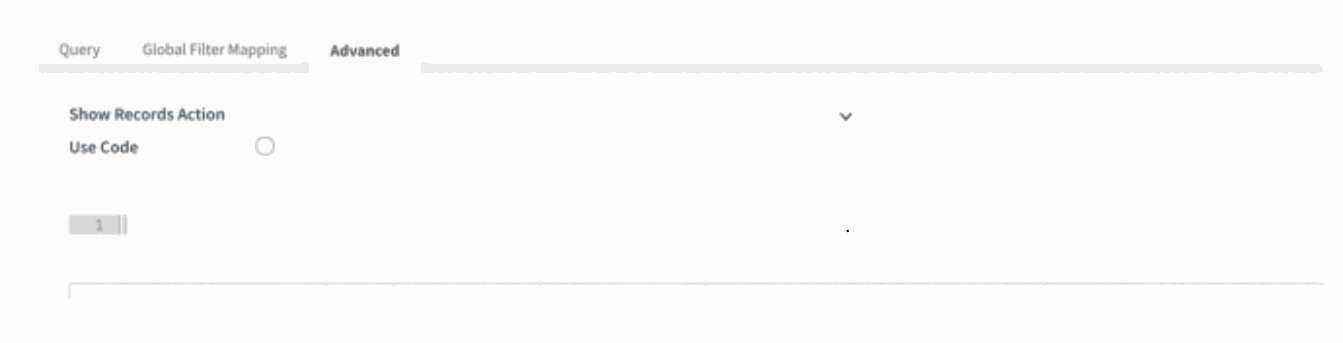
- Go to the Advanced tab and find the Show Records Action field.
)%20-%202026-02-13T084236.378.png?access_token=85887032-b508-4ac8-a73e-70807c78f4cd)
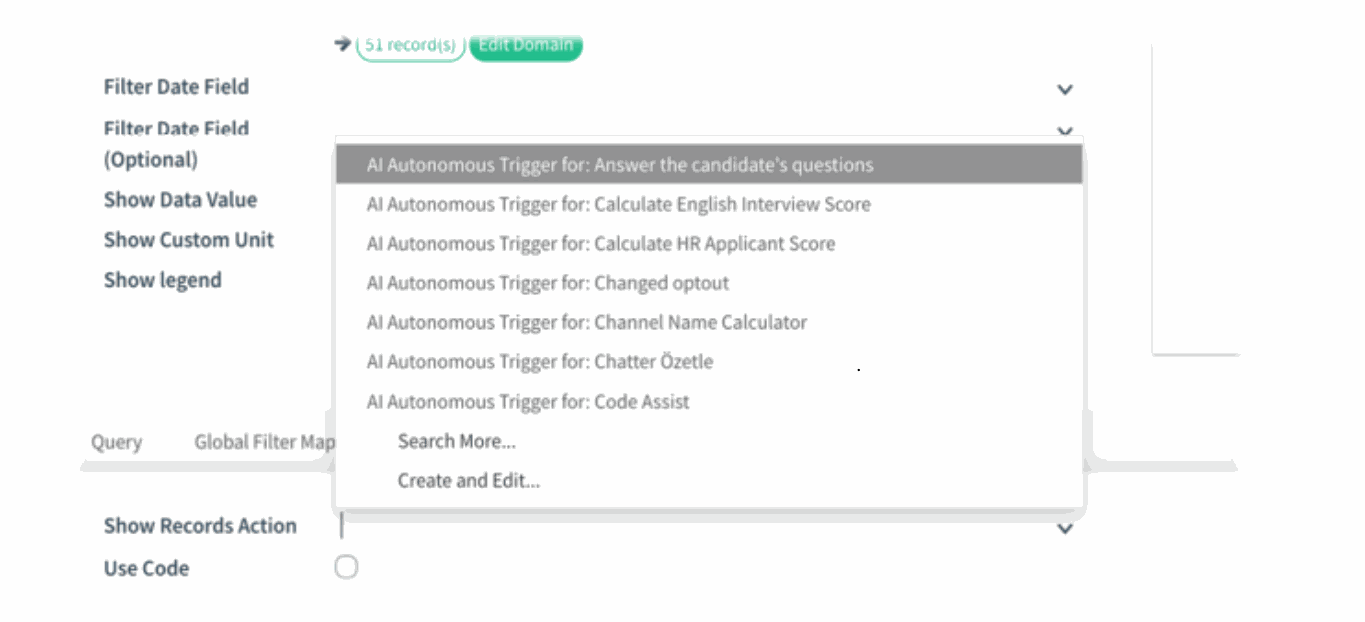
- Pick an existing server action from the dropdown, or Click Create and Edit… to define a new one.
)%20-%202026-02-12T172358.820.png?access_token=a4c28244-3ab2-462a-ac9c-0bd262fa75c3)
- In the server action, configure how the records should open — for example, group by Country, apply a domain, or set a specific context.
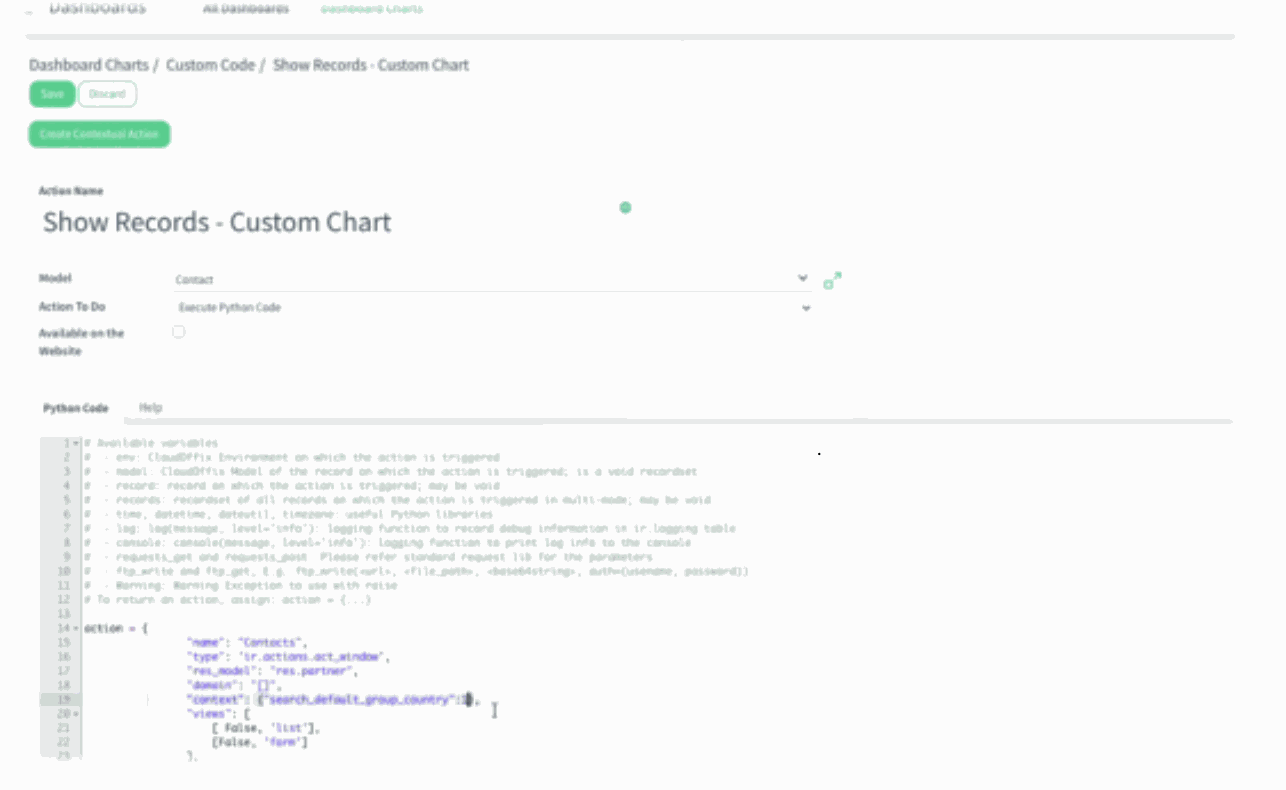)%20-%202026-02-13T084629.639.png?access_token=27fee3a4-4dcd-4009-8c3e-52012524b8a4)
- Save the server action and the chart. Now return to the dashboard and click the Info (i) icon on the chart. The linked server action opens a list view showing only the records and grouping you defined (e.g., Leads grouped by Country), ready for analysis or export.
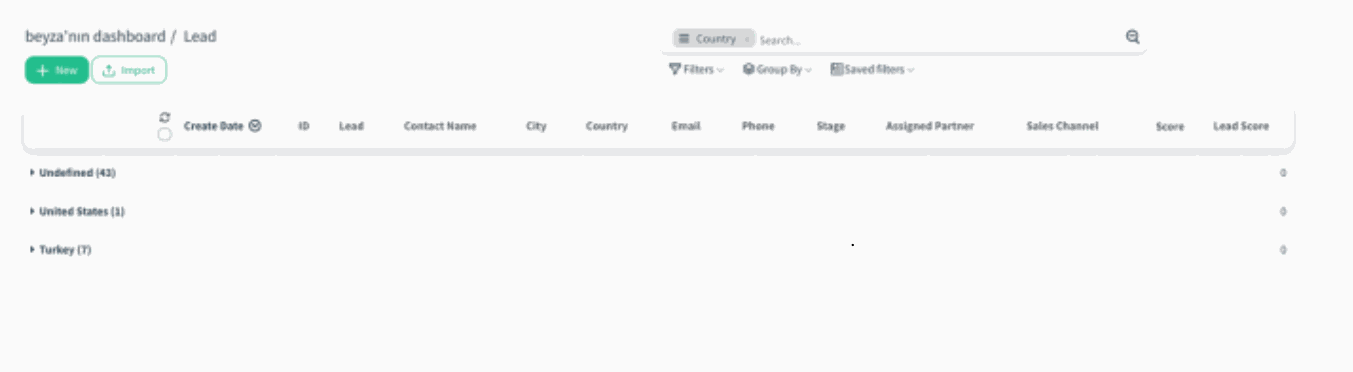)%20-%202026-02-13T084945.751.png?access_token=ec0f8b9c-d34b-47e2-b550-70a5a198e804)